
Make a donation
Gear up for your next adventure:
As an Amazon Associate, this site earns from qualifying purchases at no extra cost to you.
San Diego topographic map
Click on the map to display elevation.
Make a donation
Gear up for your next adventure:
As an Amazon Associate, this site earns from qualifying purchases at no extra cost to you.
San Diego
The climate in San Diego, like most of Southern California, often varies significantly over short geographical distances, resulting in microclimates. In San Diego, this is mostly because of the city's topography (the Bay, and the numerous hills, mountains, and canyons). Frequently, particularly during the "May gray/June gloom" period, a thick "marine layer" cloud cover keeps the air cool and damp within a few miles of the coast, but yields to bright cloudless sunshine approximately 5–10 miles (8–16 km) inland. Sometimes the June gloom lasts into July, causing cloudy skies over most of San Diego for the entire day. Even in the absence of June gloom, inland areas experience much more significant temperature variations than coastal areas, where the ocean serves as a moderating influence. Thus, for example, downtown San Diego averages January lows of 50 °F (10 °C) and August highs of 78 °F (26 °C). The city of El Cajon, just 10 miles (16 km) inland from downtown San Diego, averages January lows of 42 °F (6 °C) and August highs of 88 °F (31 °C).
Make a donation
Gear up for your next adventure:
As an Amazon Associate, this site earns from qualifying purchases at no extra cost to you.
About this map
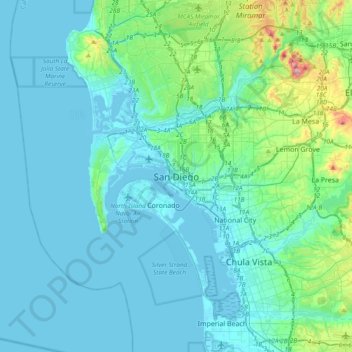
Name: San Diego topographic map, elevation, terrain.
Average elevation: 187 ft
Minimum elevation: -33 ft
Maximum elevation: 1,545 ft
San Diego County trails, hiking, mountain biking, running and outdoor activities
Make a donation
Gear up for your next adventure:
As an Amazon Associate, this site earns from qualifying purchases at no extra cost to you.
Other topographic maps
Click on a map to view its topography, its elevation and its terrain.
Make a donation
Gear up for your next adventure:
As an Amazon Associate, this site earns from qualifying purchases at no extra cost to you.
Old Town San Diego State Historical Park
United States > California > San Diego County > San Diego
Average elevation: 59 ft
Embarcadero Marina Park
United States > California > San Diego County > San Diego
Average elevation: 23 ft
Make a donation
Gear up for your next adventure:
As an Amazon Associate, this site earns from qualifying purchases at no extra cost to you.